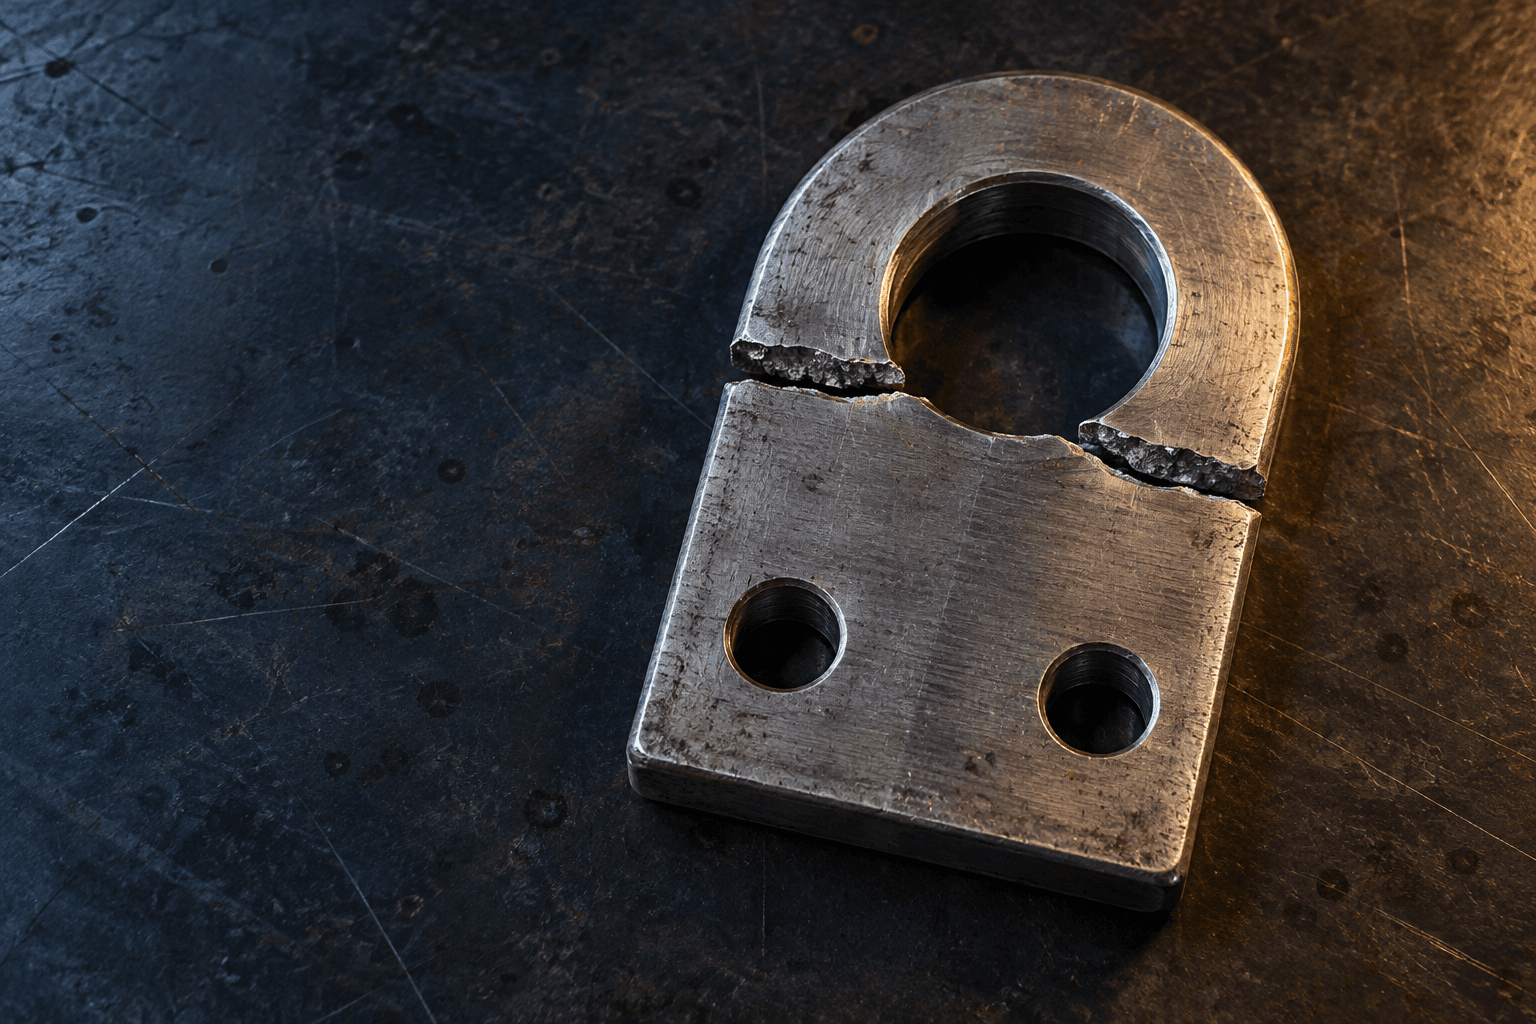
6:42 PM. A sharp crack stops the lift. The crate is secured, and Chitta receives two pieces of a steel bracket. The job sheet says the load was normal. Something doesn’t add up. Help him find it.
8–10 minNo background neededA fictional engineering case
SCROLL TO INVESTIGATE
01
6:42 PM · The workshop
Yesterday, it held. Tonight, it broke.
“Same crate. Same job,” says the operator. Chitta writes down three possibilities: too much force, a material that snaps easily, or a part that was already weakened. He keeps both broken pieces. First, he needs a fair way to compare the force with what the steel can carry.
“A broken part tells us where to look. It doesn’t yet tell us why.”
YOUR FIRST INSTINCT
What would you investigate first?
The part’s job
What exactly is a lifting bracket?
Think of it as the metal link between the lifting hook and the crate. The round hole takes the shackle pin; two lower bolts attach the plate to the frame. It must carry the weight of the whole two-ton crate—about 20 kN of force.
See how the bracket carries the crate
01 Hoist02 Shackle03 Bracket04 Crate frame
Load-path schematic—not to scale. At steady speed, tension is approximately equal to weight. Acceleration, sudden stops, swinging, and off-axis pull can raise the connector force above the static value.
02
01 · Measure the load
Was the normal load already too much?
Spread a heavy bag across two handles instead of one: each handle carries less force. Metal is similar. Stress is force divided by the area carrying it. Chitta’s original section was 100 mm². With 20,000 N of force, its average stress was 200 MPa.
LIVE CALCULATION
σ=FA
Engineering stress = Force ÷ original cross-sectional area
200.0MPa
Because 1 N/mm² = 1 MPa
Same force, changing area
Try halving the area to 50 mm². The stress doubles without adding any weight. Remember that clue. This is an average; stress can be higher around holes and cracks.
Then Chitta measures the response
Strain asks: how much did its length change?
Strain is the stretch compared with the starting length. A 50 mm sample stretched by 0.5 mm has 1% strain. Move the length slider to measure the stretch in this separate experiment.
050.05 mm
ε = ΔL / L₀0.100% strain
03
02 · Test an intact sample
Will it stretch—or just snap?
Chitta preserves the broken bracket and tests an intact sample of the same steel, from spare stock. The narrow middle makes the stretch easy to measure. Watch the sample and its curve together: up means more stress; right means more stretch.
Steel sample: permanent stretch, a narrowing neck, then a break. Animated teaching schematic; shape changes are exaggerated. The test sample is not the lifting bracket.
StartBreak
SAME-STEEL SAMPLEElastic
A little more pull gives a little more stretch. Release it here and the sample springs back.
Stress · force per area
≈ 0 MPa
Strain · stretch
0.000%
Ductile · the whole test
Strain · stretch as a percentage of original length (%)
Horizontal scale: 0–30%. The steep beginning is easier to see with the zoom view.
Representative engineering curve: linear elastic response to about 0.125 percent strain and 250 MPa yield, a short yield plateau, strain hardening to 450 MPa ultimate tensile strength near 18 percent strain, then necking and fracture near 25 percent strain.
Teaching playback, not a real test speed. The first small stretches are slowed down. Use the slider to stop at any moment.
WATCH FOR THIS
Does the middle get thinner before the sample separates?
05
03 · Compare the behavior
What if it had been brittle?
Chitta pulls a ceramic comparison sample. Unlike the steel, it breaks with almost no permanent stretch. The difference is easier to see when the charts use the same scales.
Two materials. Separate charts. Identical scales.Start with the whole test. Then zoom both charts to see the tiny stretch before the ceramic breaks.
Steel stretches first.
Ductile steel · shared scale
Strain · stretch as a percentage of original length (%)
Both charts: 0–30% strain, 0–500 MPa stress. Same scales.
Representative engineering curve: linear elastic response to about 0.125 percent strain and 250 MPa yield, a short yield plateau, strain hardening to 450 MPa ultimate tensile strength near 18 percent strain, then necking and fracture near 25 percent strain.
The long rightward curve records permanent stretch. The thin neck forms near the end.
Stretch at break
≈ 25%
Elastic stiffness
200 GPa
Ceramic breaks early.
Brittle ceramic · shared scale
Strain · stretch as a percentage of original length (%)
Both charts: 0–30% strain, 0–500 MPa stress. Same scales.
Illustrative dense-alumina tensile response: nearly linear elastic behavior with an elastic modulus around 380 GPa, followed by brittle fracture near 300 MPa and 0.079 percent strain without macroscopic yielding. Actual values vary substantially with grade, porosity, flaw population, specimen size, and test method.
Its entire curve is squeezed against the left axis. It really does break at a very small strain—use the shared zoom to see it.
Stretch at break
≈ 0.079%
Elastic stiffness
380 GPa
STIFFNESS ≠ DUCTILITY
This ceramic is stiffer than this steel: it stretches less under the same stress. But it also breaks with very little permanent stretch. A steep line tells stiffness; a long plastic region tells ductility.
One more material: aluminium
6061-T6 aluminium is also ductile. It is less stiff than steel and has no sharp yield point; its 0.2% proof strength is a practical measure of the onset of permanent stretch.
Ductile · the whole test
Strain · stretch as a percentage of original length (%)
Horizontal scale: 0–30%. The steep beginning is easier to see with the zoom view.
Representative 6061-T6 engineering curve: 69 GPa elastic modulus, 275 MPa 0.2 percent proof strength, 310 MPa ultimate tensile strength near 8 percent strain, and fracture near 12 percent strain.
Representative teaching curves, not design allowables. Temperature, grade, heat treatment and flaws can change the response. This ceramic is a comparison sample, not the bracket material.
04 · The missing evidence
The steel could stretch. So why did this bracket break?
The tensile test cannot explain this break on its own. Chitta examines the recovered part and requests the hoist log. Open the evidence in order and see what the test missed.
The same recovered plate · illustrative image, not an inspection photograph
01 · THE PART02 · THE EVENT03 · THE RECONSTRUCTION
06
05 · Solve it with Chitta
Could you explain the break to a friend?
1 / 3
A loaded part returns to its original length. Where did it stay?
Try the next job: give a replacement more margin
07
Optional · An engineering follow-up
Give the replacement some breathing room.
Chitta would not simply fit another identical part. Try more area or less load. In this classroom check, we keep stress below 166.7 MPa: the 250 MPa yield strength divided by a safety factor of 1.5. Passing this one check does not approve a lifting bracket.
!
AVERAGE NOMINAL AXIAL STRESS
194.4 MPa
Required limit
166.7 MPa
Yield-based factor
1.29
Does not pass this preliminary check
Increase the area, reduce the design load, or select an appropriate material—then repeat the full lifting-device assessment. This screen alone cannot certify a bracket.
Take a closer look: six moments on the steel curve
04
03 · Learn to read the test
Six moments. One piece of metal.
Select a moment to see what changed. Elastic and yield use a close-up of the start, so those tiny stretches are visible. The other moments show the whole curve.
↑ UP More stress: the metal is working harder.→ RIGHT More strain: the sample is stretching further.
Close-up · the first stretch
Strain · stretch as a percentage of original length (%)
Magnified horizontal scale: 0–0.7%. This is the beginning of the same curve.
Representative engineering curve: linear elastic response to about 0.125 percent strain and 250 MPa yield, a short yield plateau, strain hardening to 450 MPa ultimate tensile strength near 18 percent strain, then necking and fracture near 25 percent strain.
IElastic
A tiny, spring-like stretch. Let go here and the sample returns to its original length.
ONE-LINE MEMORY TOOL
Slope tells stiffness. Yield starts permanent stretch. Peak is ultimate strength. Stretch before breaking tells ductility.
Why the line falls after the peak
After the peak, stretching concentrates in one thin spot: the neck. The sample carries less force, so this curve falls. It is still moving toward a break. Engineering stress uses the original area; true stress uses the shrinking area at the neck and can keep rising.
Case 01 · Resolution
A curve explains the material. Clues explain the failure.
Stress asks how hard the material is working. Strain asks how much it stretches. Ductile materials can stretch permanently; brittle ones break with very little stretch. But a test curve alone cannot tell you why a particular part failed.
TAKE THIS WITH YOUA stress–strain curve maps material behaviour under a standard test. Real failures still demand the actual load path, geometry, defects, and service history.
Curious? Sources and limits of this story
The incident and inspection findings are fictional. Curves are representative teaching data, not design allowables. Ductility depends on material, temperature, loading and defects.